Grid Diagnoze
Industrial Asset Management, Inspection & Maintenance Platform
From a small mobile task in 2018 to responsibility across the complete Grid Diagnoze technical platform.
Grid Diagnoze is a complex industrial web and mobile platform used to manage assets, inspections, maintenance, measurements, equipment condition and operational history.
ReallyBeyond has worked with Grid Diagnoze since 2018. What began with a small mobile task gradually developed into long-term responsibility across the mobile application, web platform, backend, database, testing, deployments and infrastructure.
Today, a dedicated ReallyBeyond team works across the complete technical system.
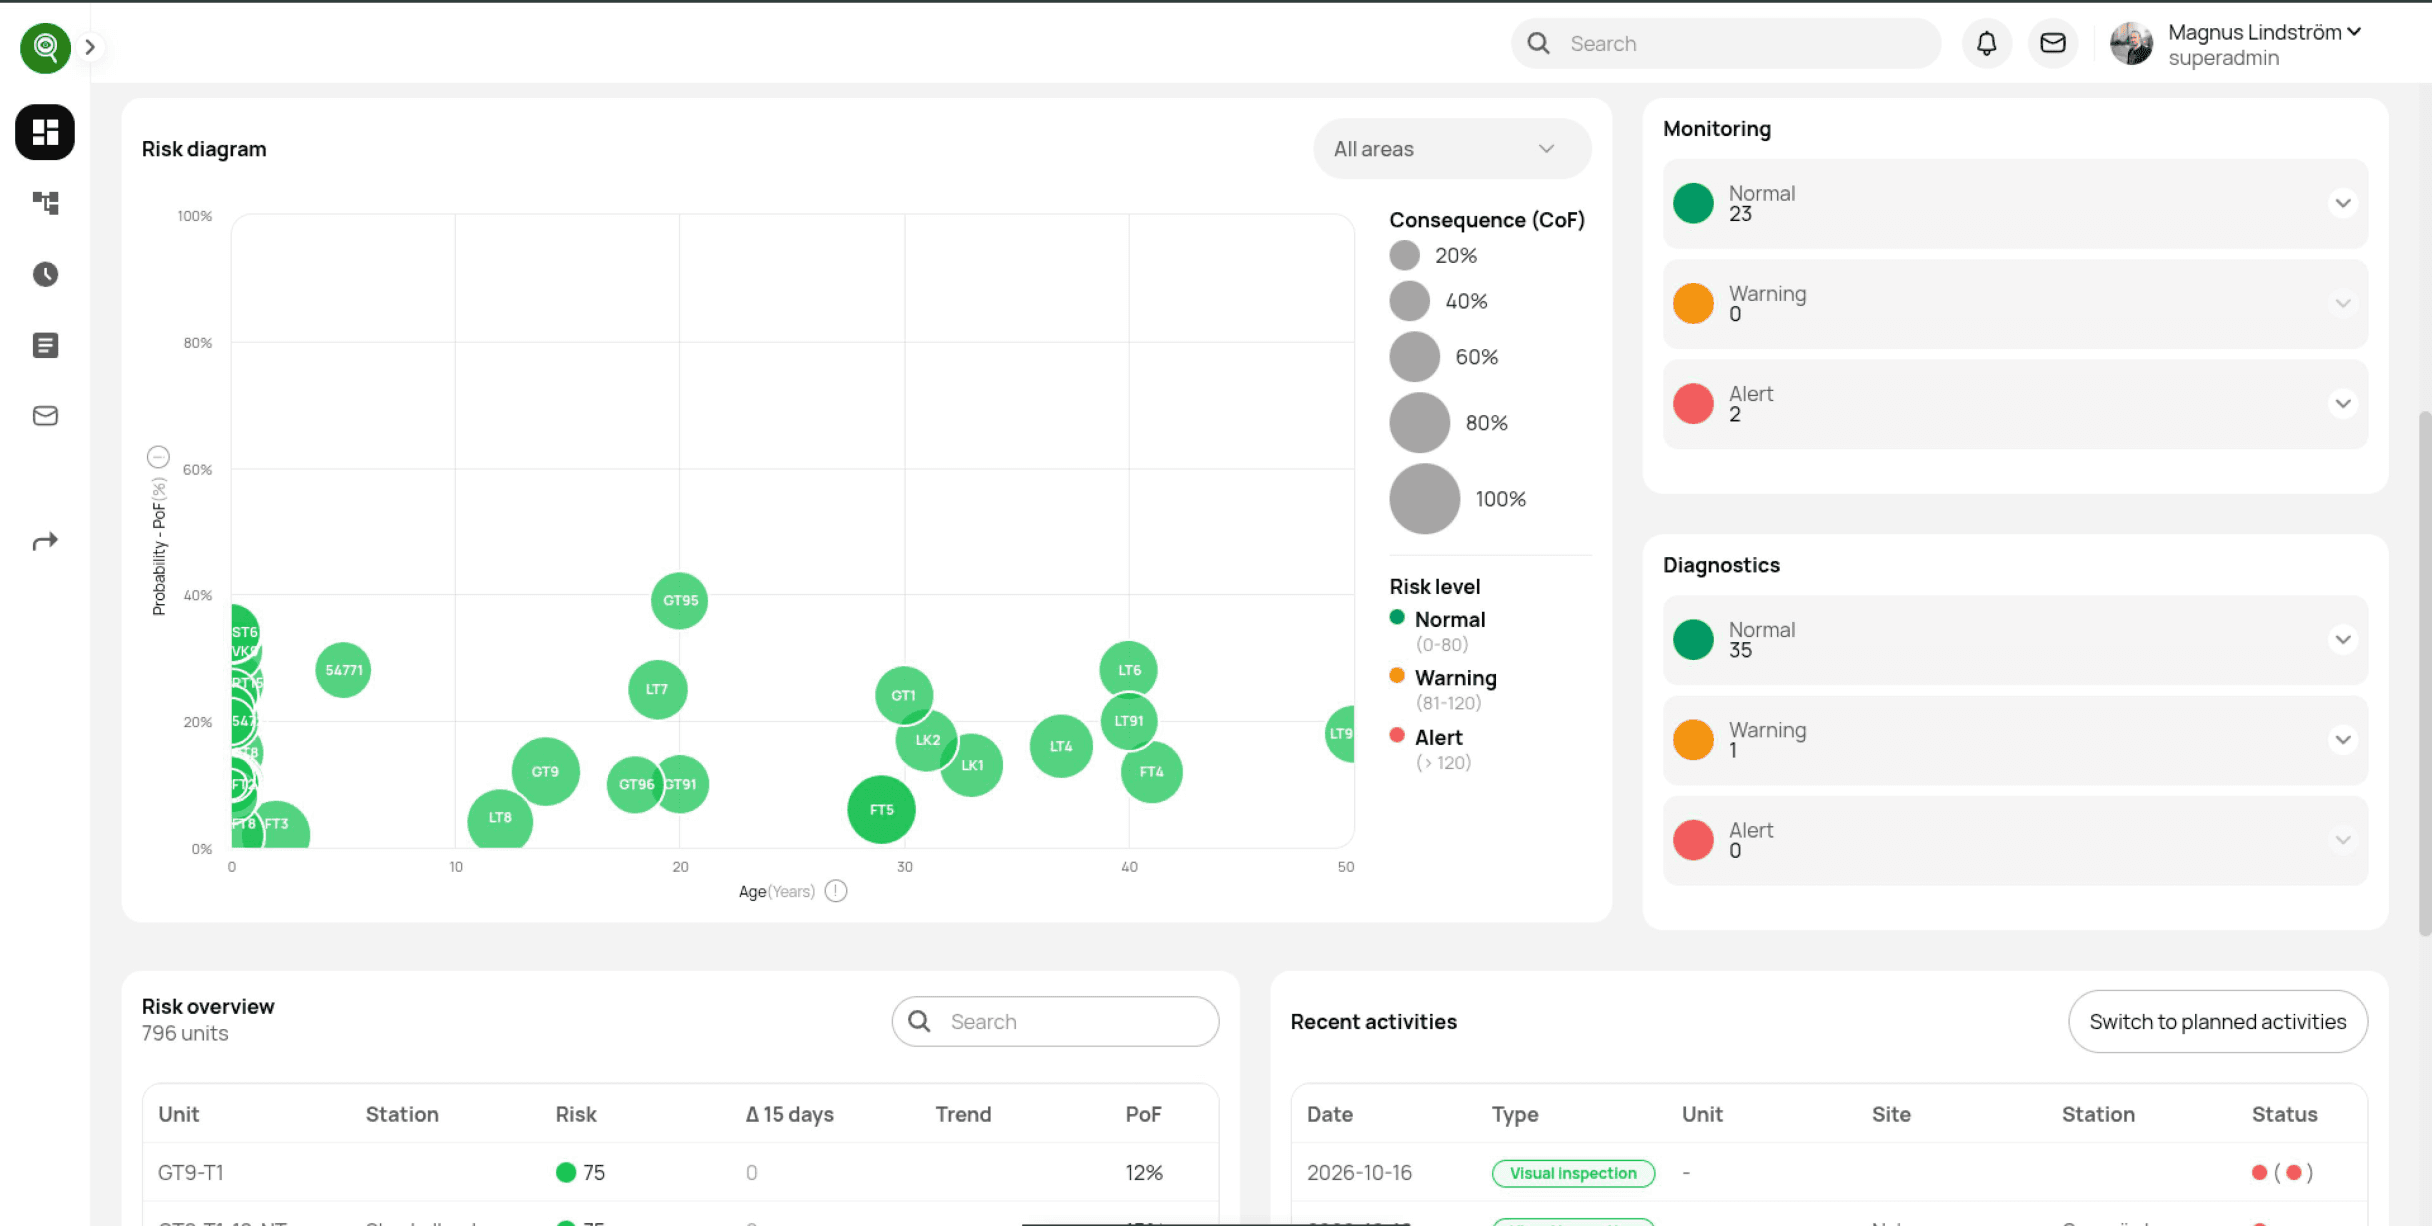
Web · Mobile · Backend · Data · Infrastructure · QA · Ongoing Development
Discuss Your ProjectAt a Glance
- Long-term collaboration
- Since 2018
- Measurements handled by the platform
- 500M+
- EWI records after optimization
- 470M to 4.5M
- Mobile · Web · Backend · Database · Infrastructure
- Full Platform
It Started With a Small Mobile Task
Our relationship with Grid Diagnoze began in October 2018.
Magnus Lindström contacted us about an existing mobile application that he was having difficulty compiling for Android and iOS.
At first, the task appeared relatively small. Once we investigated the application, however, we found that its libraries and dependencies were outdated. Rather than simply trying to force the old project to compile, the team created fresh projects around the existing source code, updated the required libraries and versions, and brought the application back into working condition.
After that work was completed successfully, Magnus moved forward with the larger application he had already been planning.
That became the beginning of our work on Grid Diagnoze.
Building the Mobile App and Expanding Across the Platform
ReallyBeyond went on to build the Grid Diagnoze mobile application from scratch and later developed the complete frontend for the web platform.
The backend already existed, but over time our responsibility expanded into that part of the system as well. The mobile application initially included workflows such as visual inspections, maintenance and operational activities.
These can look simple from the outside. In practice, they depend on a much larger system of business rules.
What appears during an inspection can depend on the asset being inspected, its configuration, the questions associated with it, previous activity and the wider logic maintained across the platform. The team therefore had to understand much more than individual screens.
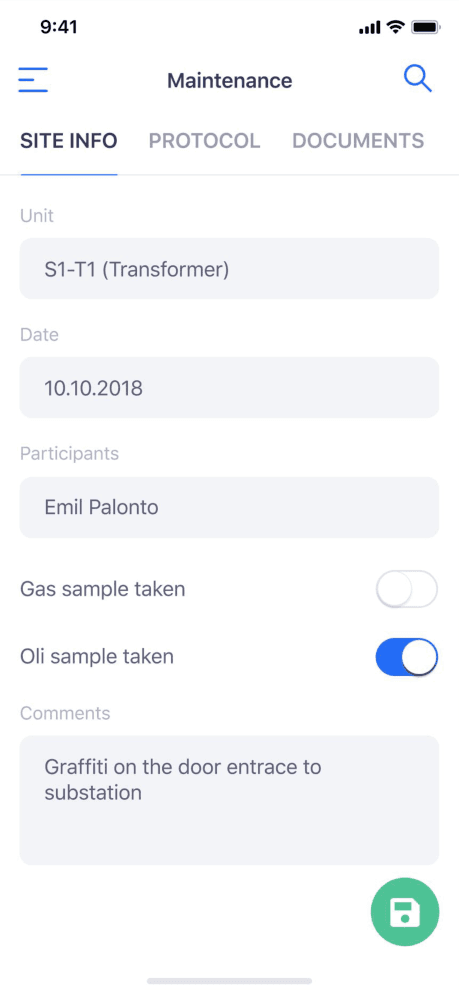
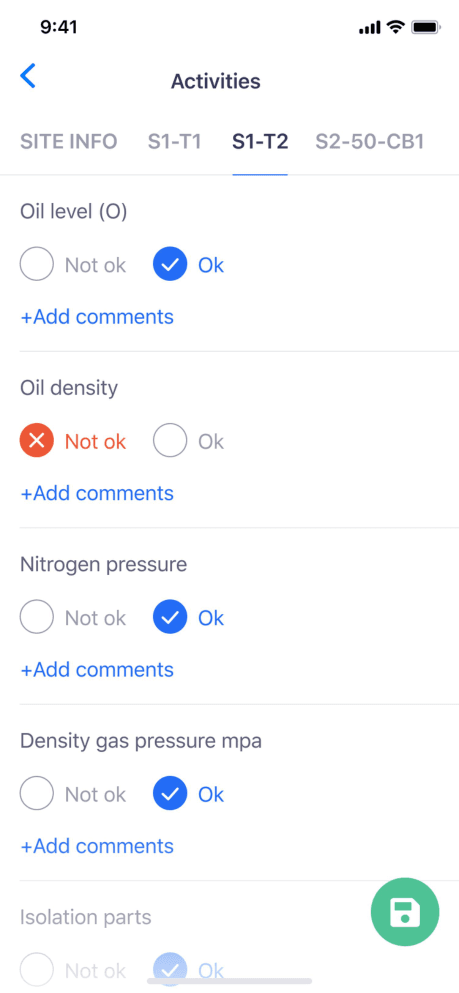
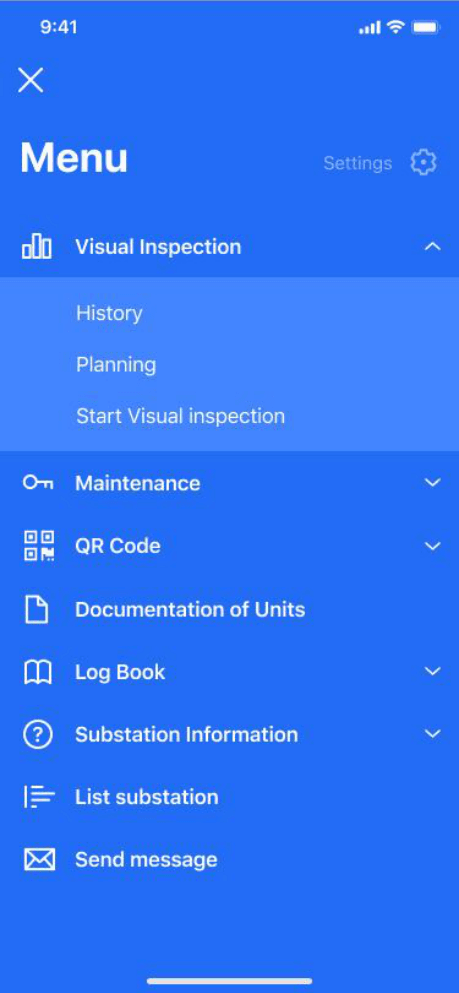
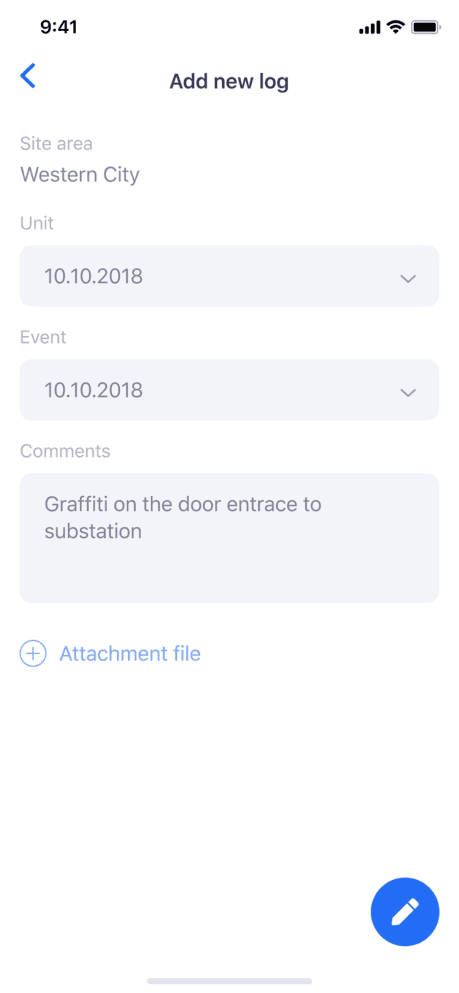
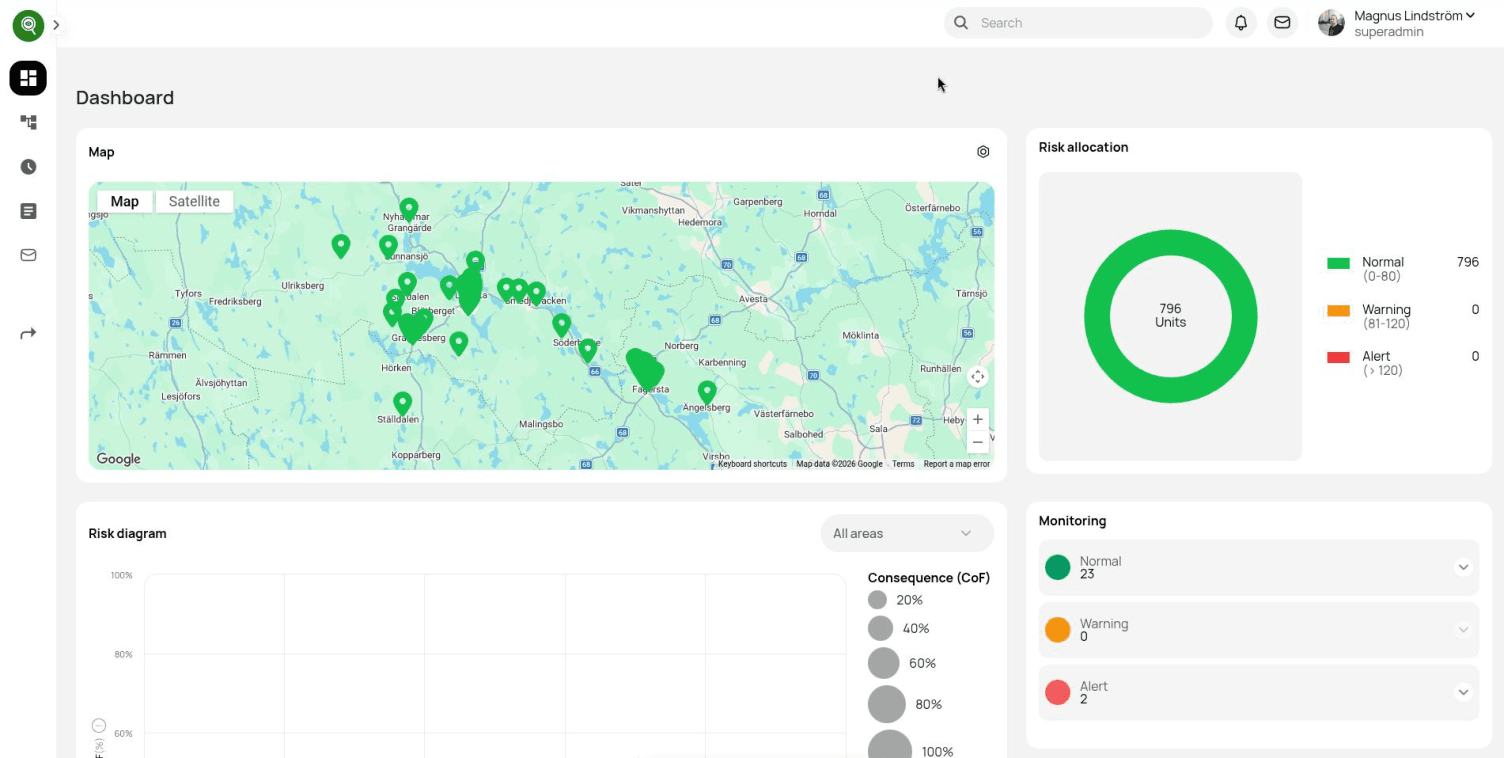
Over time, ReallyBeyond built knowledge across the wider Grid Diagnoze system, including sites and units, visual inspections and maintenance, planned activities, operational history, EWI calculations, online measurements, custom measurements, risk analysis and user permissions.
This accumulated product knowledge became increasingly important as our responsibility expanded deeper into the platform.
Engineering for Large Volumes of Industrial Data
One of the areas that best demonstrates the technical scale of Grid Diagnoze is measurement handling. ReallyBeyond is not responsible for the physical sensors themselves. Measurement information reaches the platform through API calls. Incoming data is queued using RabbitMQ so that large volumes can continue to be received even when everything cannot be processed immediately.
The measurements are stored using PostgreSQL with TimescaleDB, where they can be aggregated using calculations such as minimum, maximum, average and sum across different time ranges. Measurements can also trigger EWI calculations and custom measurement calculations.
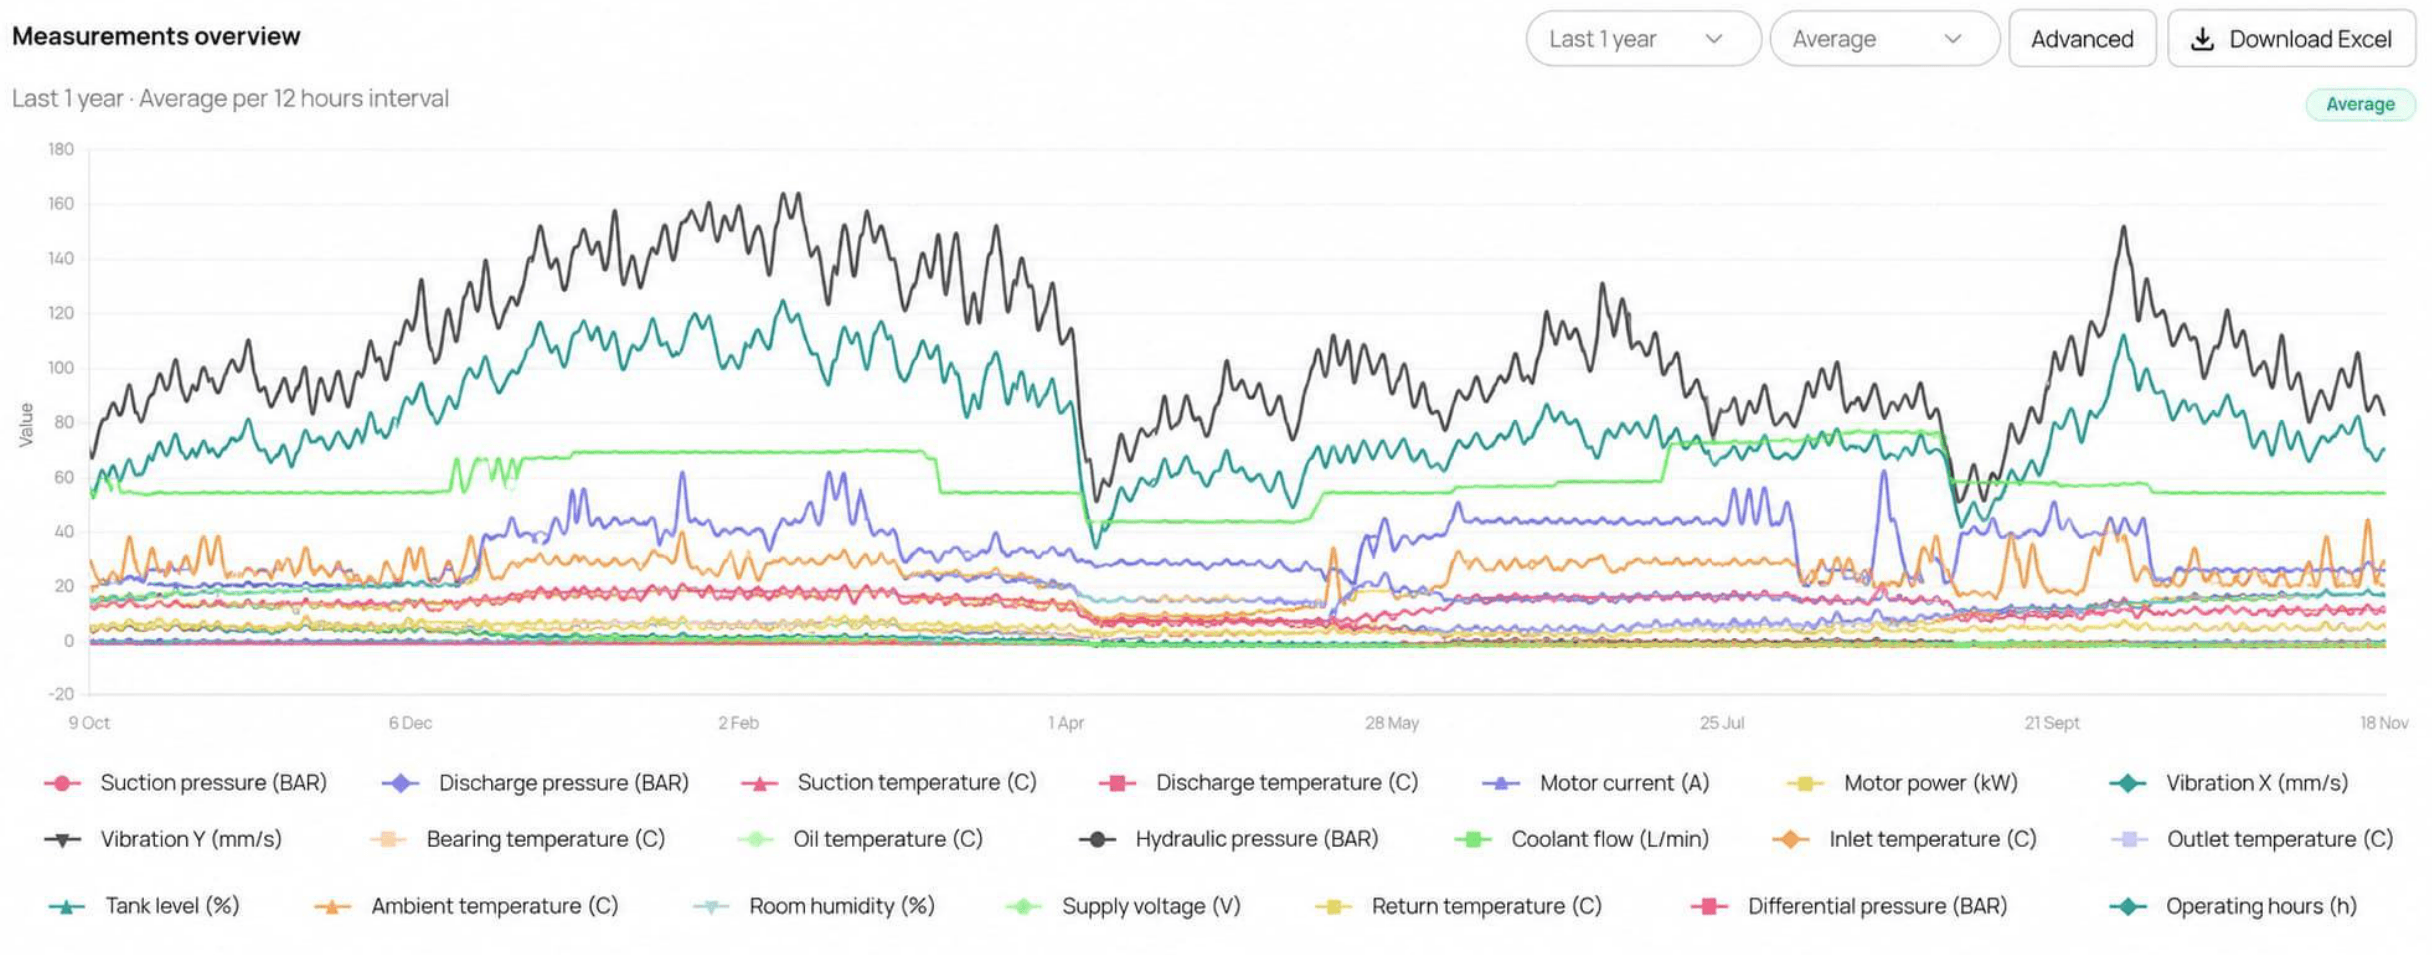
The platform contains more than 500 million measurements, with incoming measurement traffic estimated at around 500,000 to 600,000 requests per day. At this scale, performance problems that are insignificant with small datasets can become serious.
In one case, historical graphs had become slow because years of accumulated measurement data had to be transferred, processed and summarized across different time intervals.
The team optimized how these large historical datasets are queried and summarized, significantly improving graph performance.
Reducing 470 Million EWI Records to 4.5 Million
EWI, or Early Warning Indicator, is one of the more technically complex areas of Grid Diagnoze.
Its calculations use weighted mathematical formulas built from different sources of information. Activities such as maintenance and visual inspections can trigger new EWI calculations, while measurement data can also interact with the wider calculation process.
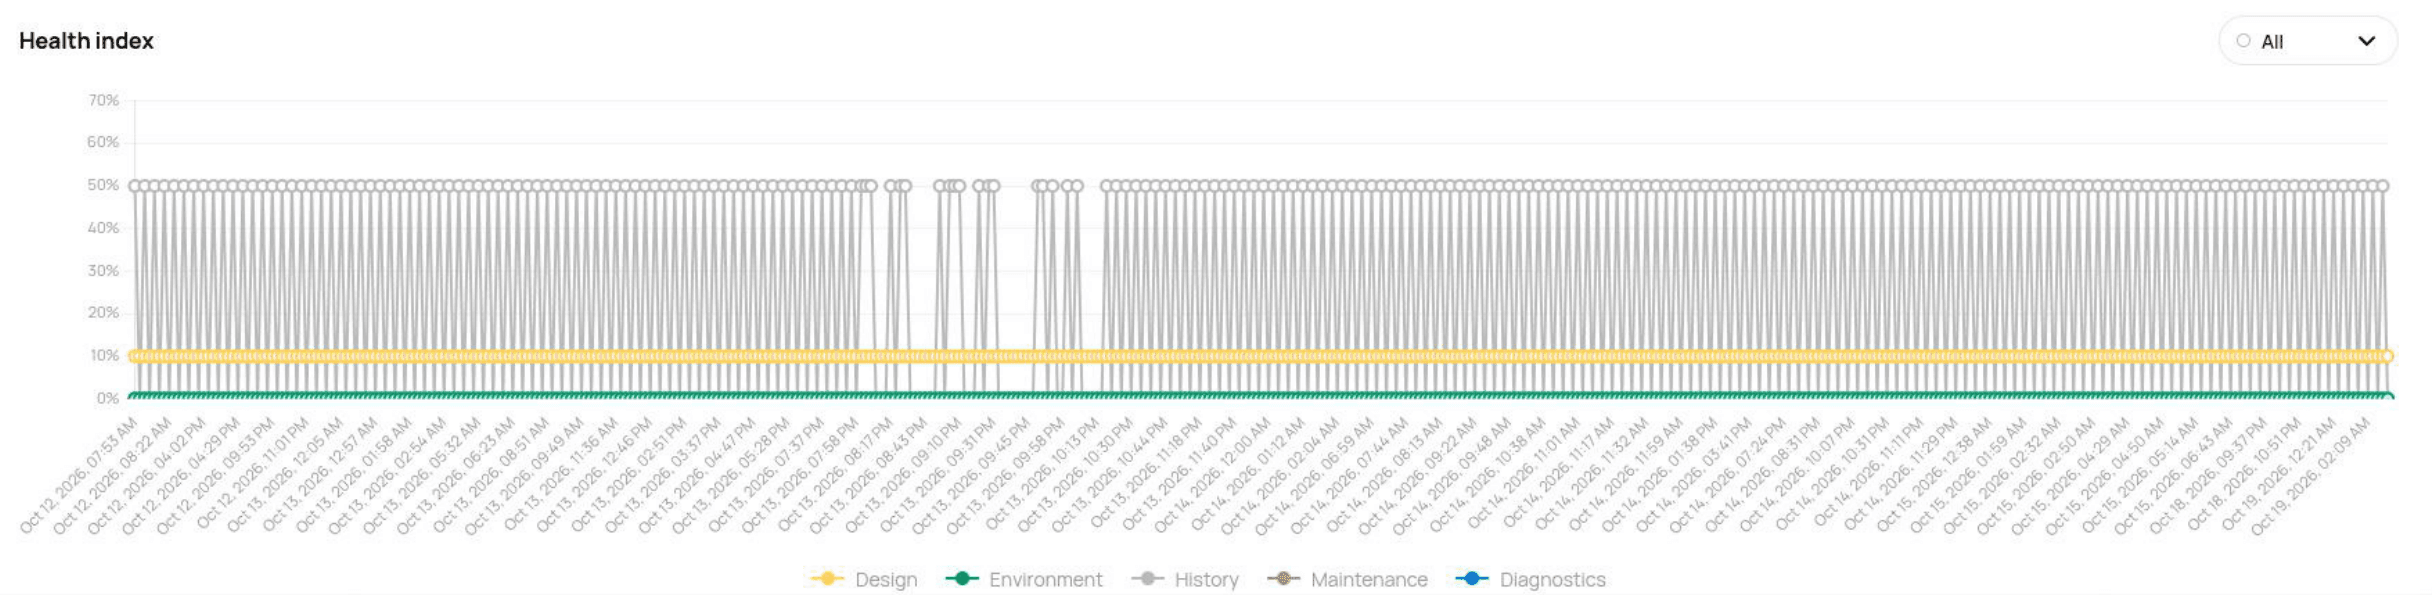
Over time, approximately 470 million EWI records had accumulated in the database. The important discovery was that many of those records did not represent meaningful changes. Every new measurement could trigger another EWI calculation even when the resulting EWI state remained exactly the same. This created large numbers of duplicated states.
ReallyBeyond changed the approach so that the system retains the first state for each hour together with meaningful EWI transitions, while removing duplicated states that add no new historical information.
The result was a reduction from approximately:
470 million records to 4.5 million records
Important historical changes were preserved.
The improvement also removed major bottlenecks affecting dashboard graphs and unit EWI pages that had previously placed heavy load on the server.
This is a good example of the kind of engineering work that is often invisible to the end user. The visible outcome may simply be that a graph loads properly. Behind that result can be hundreds of millions of historical records, mathematical calculations, database behavior and years of accumulated data.
Improving Complex Business Logic
Performance is only one part of maintaining a platform like Grid Diagnoze. As ReallyBeyond became more involved in the existing system, the team also worked on making important business logic easier to understand, maintain and extend.
Planned Activities
Planned maintenance activities depend on information such as the asset, previous maintenance, maintenance intervals, dates and the relationships between sites, units and components. Some of this calculation logic had been duplicated across different parts of the codebase. ReallyBeyond centralized and optimized the logic so that these calculations can be handled more consistently and maintained more easily.
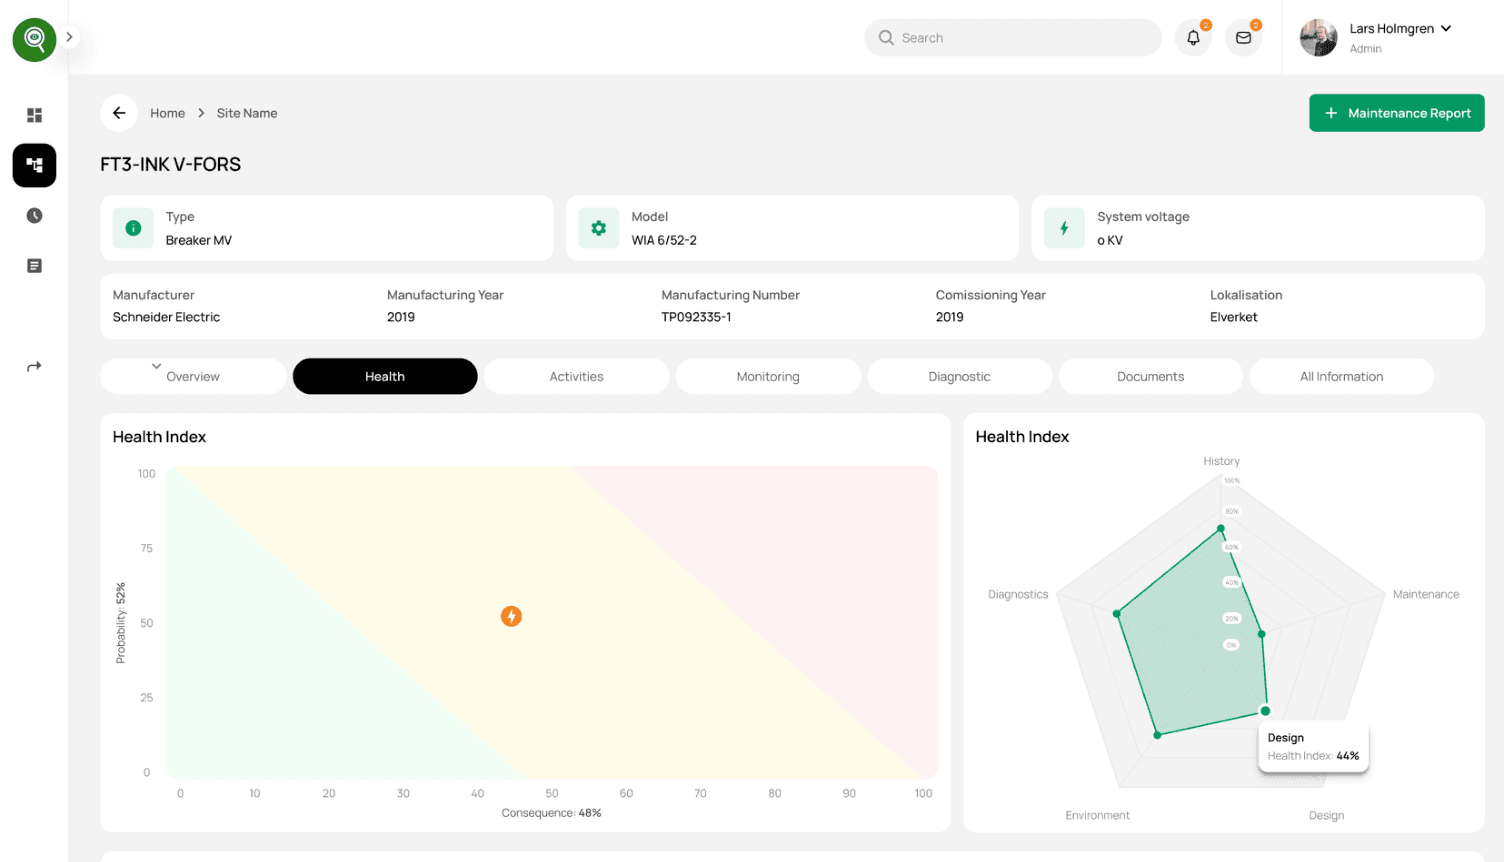
Sites and Units
The team developed new interfaces and optimized backend endpoints for Sites and Units, improving both usability and technical performance.
Permissions
Authorization across the platform was also reviewed and user capabilities were adjusted to make role-based access more consistent.
Shared Web and Mobile Logic
Some Grid Diagnoze behavior exists in both the web and mobile applications. Maintaining the same logic separately creates risk. A change can be made in one application and accidentally forgotten in the other. To reduce this risk, the team created a private shared package for common functionality so that important behavior can remain consistent across web and mobile.
Turning Engineering Information Into Useful Decisions
Grid Diagnoze is not simply a database of industrial equipment.
The platform has to turn technical information into something understandable enough for people to use when inspecting, maintaining and assessing industrial assets. This includes visualizations such as EWI, Risk, Risk Allocation, diagnostic graphs and measurement history. Custom measurements also allow customers to define calculated values using underlying measurements.
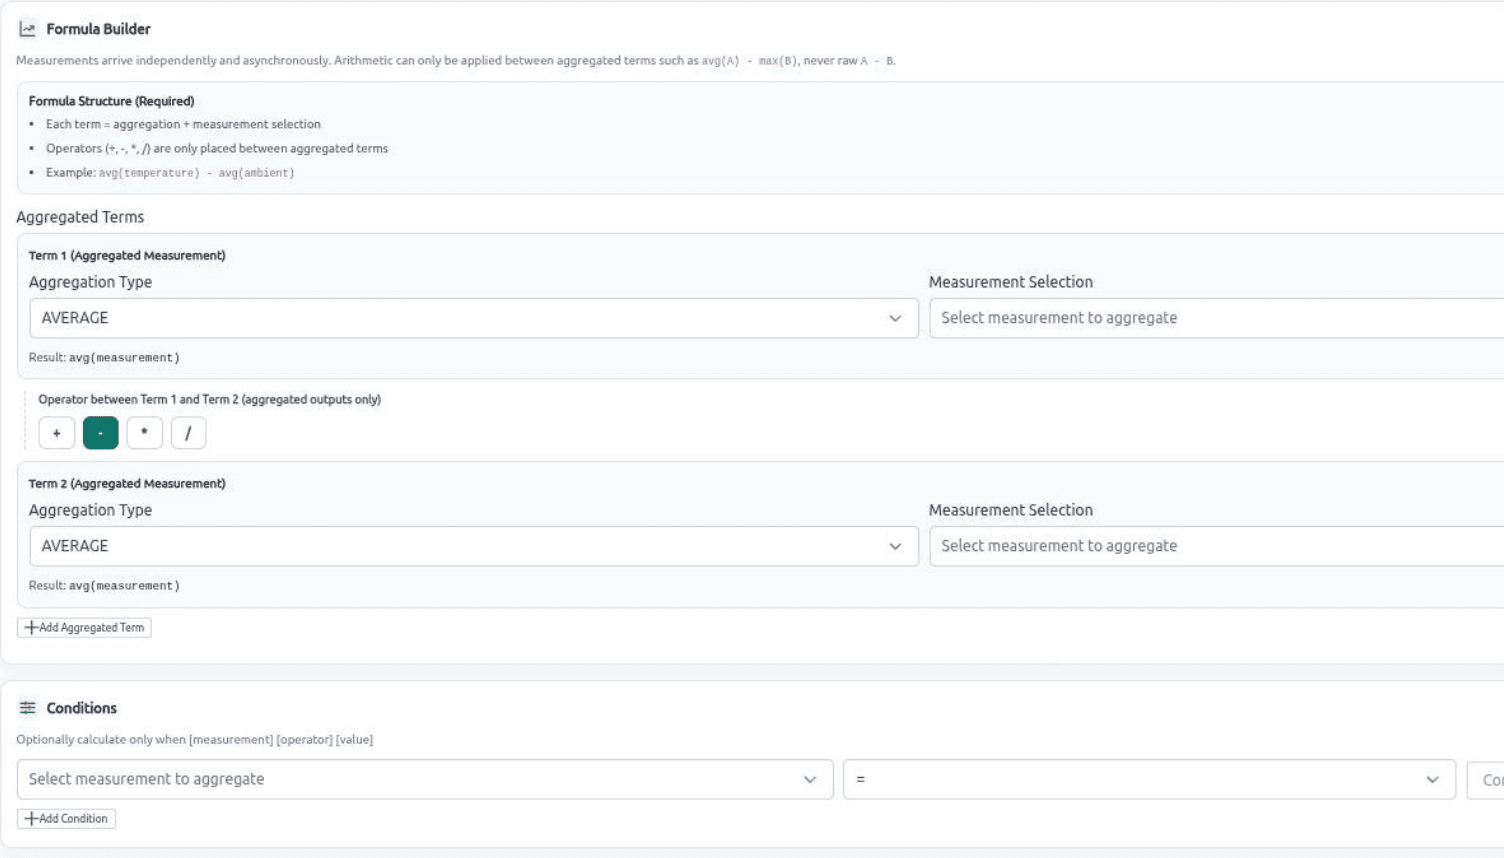
For example, a customer can calculate the difference between two temperature measurements and use that calculated value alongside other operational information. The resulting graphs may look simple to the user.
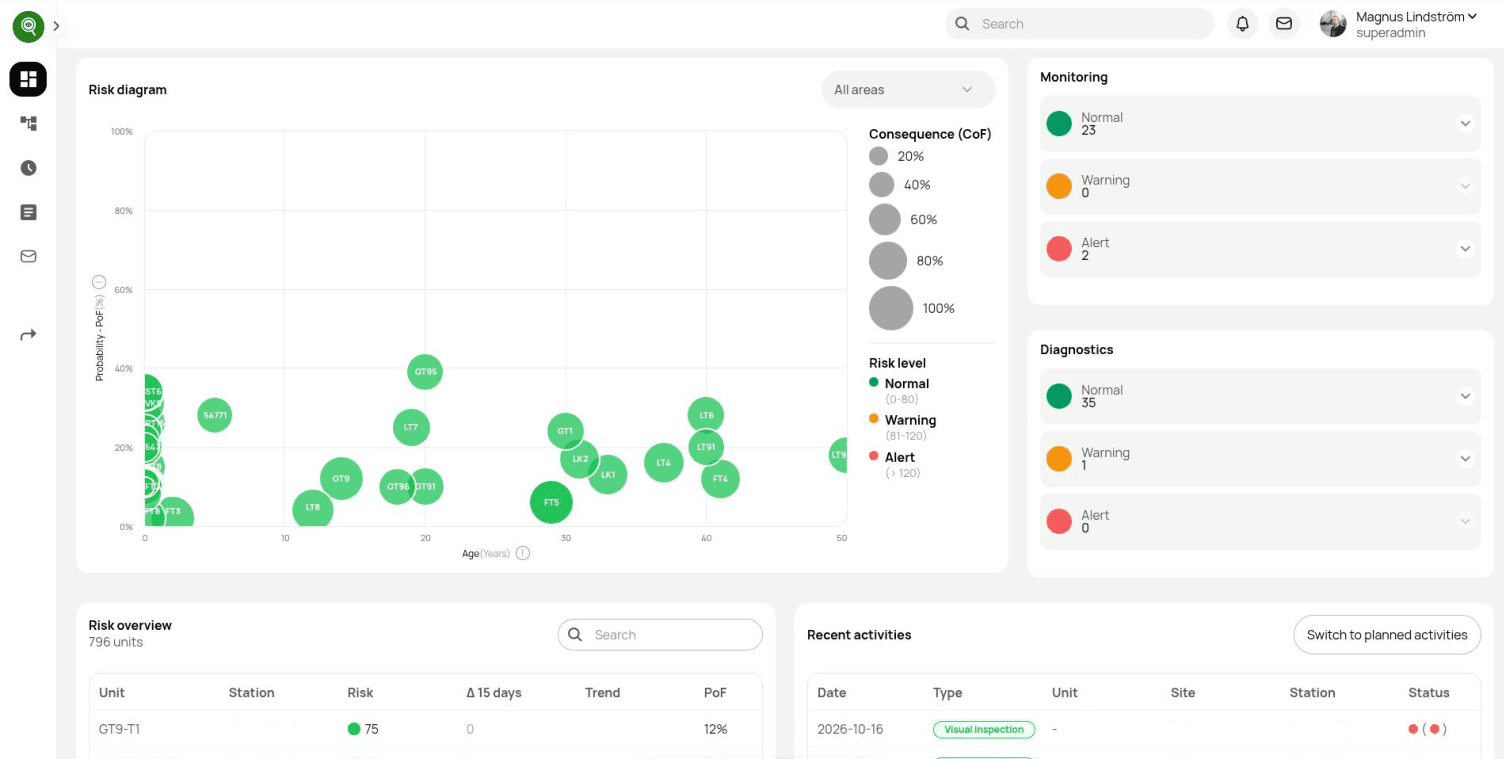
Their reliability depends on the underlying calculations, asset relationships, historical information and data-processing logic being correct first.
From Development Support to Complete Technical Responsibility
The scope of the relationship has changed significantly since 2018.
ReallyBeyond now works across:
Database · Backend · Web · Mobile · Servers · Infrastructure · Testing · Deployment · Ongoing Development
This responsibility developed gradually as the team gained deeper knowledge of the product and demonstrated that it could work safely with increasingly important parts of the system.
The normal development process includes clarifying requirements, development, developer testing, deployment to the test environment, QA and client review, fixes where required, and then production deployment.
The technical environment today includes Angular on the web, React Native for mobile, Python and Django on the backend, PostgreSQL with TimescaleDB, Celery and RabbitMQ for background processing, Microsoft authentication and New Relic monitoring.
But the most important part of the relationship is not the list of technologies.
It is continuity.
After years of working with Grid Diagnoze, the team understands how different parts of the platform relate to one another, which workflows are sensitive, where important business rules live and what needs additional care when something changes. Grid Diagnoze does not need to rebuild that technical knowledge with a new group of people every time the product evolves.
It has a dedicated team that already understands the system and can continue taking responsibility for it.
Client Perspective
“I have worked with Shoaib and ReallyBeyond for several years.
They built our mobile application from scratch and developed the complete frontend for our web platform. The backend already existed, but over time they have also taken responsibility for that and are improving and refactoring it step by step, especially where old code was causing problems with data integrity and other parts of the system.
Today the team works with the complete system, database, backend, frontend, mobile app, servers and infrastructure. They develop new functionality, improve existing parts of the platform, do testing and also take care of deployment.
Grid Diagnoze is quite a complex system with many types of equipment, inspections, maintenance, measurements, EWI calculations and online monitoring. What I like is that the team has learned how the whole system works. They don’t only develop what I ask for, they also find problems themselves and suggest how things can be improved.
I discuss what we need with Shoaib and he takes care of organizing the developers and testing. For me this makes the work much easier because I don’t need to manage different people separately.
ReallyBeyond understands Grid Diagnoze very well now and can take responsibility for the complete technical side of the platform. I am very happy with our cooperation and hope we continue working together for a long time.”
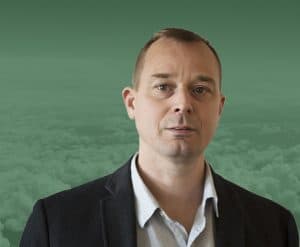 Magnus LindströmCEO, Grid Diagnoze, Sweden
Have a Complex Software Platform That Needs Long-Term Ownership?
If your software has become too important or too complex to manage through disconnected developers and vendors, we can step into an existing system, understand how it works and take broader responsibility for its continued development.
Discuss Your Project